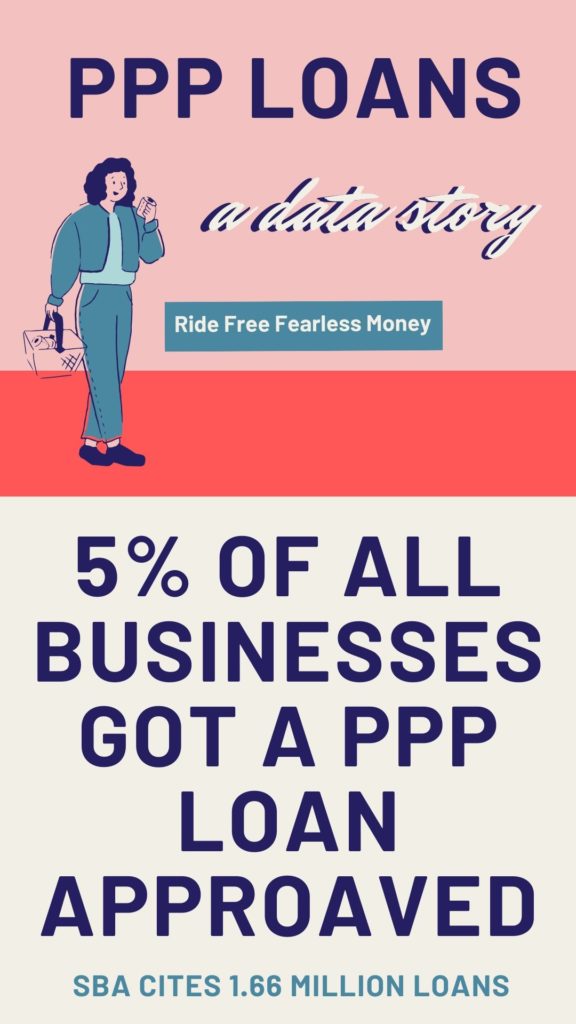
On April 16, the SBA released data on loans generated by its PPP Program: 1.66 million loans to businesses went out through banks, putting over $342 billion into the economy, of which 75% is to be used to pay employees.
Here’s a video series on the topic, below read up on data!
Great – but what do those numbers mean?
Data we get should trigger this question: as compared to what? That, friends, is what we explore in this article and video (scroll down for it!).
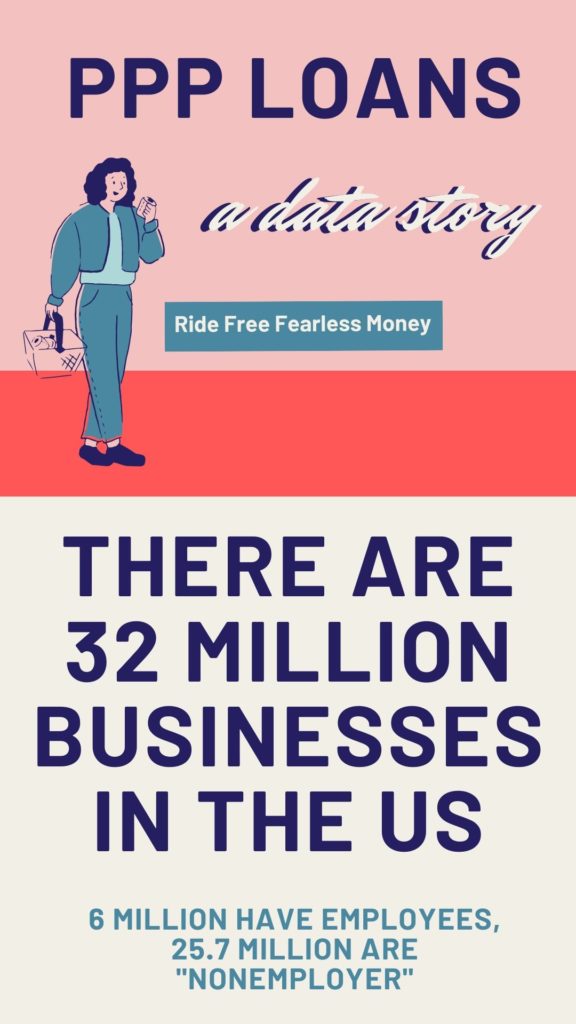
2017 US Census Data has open data available on businesses in the US, and the most recent public data is from 2017 when they tabulated 5.997M (that’s million) businesses with employees in the US, based on NAICS codes. (That’s the business category you have to fill in when doing taxes or getting an EIN), employing 128.6M people.
But that’s only 1 in 5 businesses, because there were another 25.7M “nonemployer” businesses, which would include self employed and gig economy workers getting 1099s, giving us a grand total of 31.7M business entities and no “real” data on how many people were employed in all these 😉 since many gig economy workers also have full or part time jobs at employer companies.
Digging into the data, we learn a few things:
- Of total businesses, approximately:
- 25% are minority owned
- 37% are women owned
- 17% are minority women owned [cite]
- The “nonemployer” category is 81% of all business entities: these sole proprietors, LLC partnerships, and other business types don’t run payroll.
- Of all businesses, 18.8% are ones with 1-500 employees, employing over 60M people, which is 46% of the full time workforce and the main intended recipients of the PPP loans.
- Of all businesses, 11.6% are very small SBEs with 1-4 employees, employing 6M people, or just under 5% of the full time workforce, but covering ~10% of intended employee recipients of PPP loans.
Therefore if we want to know if PPP loan disbursement was distributed fairly based on business distribution, the questions to start with are:
- Did loans go out evenly, based on company size and employee distribution?
- Did very small businesses get at least 10% of the funding?
- Did at least 37% of the funding go to women-run businesses?
- Did at least 25% of the funding go to minority owned businesses?
We don’t have this data back, yet, but we do have sample surveys, like ones from lenders like Lending Tree, business associations, national advocates — and more are on the way.
USE OF LOANS FOR BUSINESS FINANCING
CBS shared an article stating that “Roughly 95% of Black-owned businesses, 91% of Latino-owned businesses, 91% of Native Hawaiian or Pacific Islander-owned businesses, and 75% of Asian-owned businesses stand close to no chance of receiving a PPP loan through a mainstream bank or credit union,” based on the assumption that banks would prioritize processing applications for entities with whom they had an existing relationship
SBA data indicates that only about 4.6% of minority-owned businesses have used bank loans, and might have an existing bank lender relationship (as well as the even tinier 3.6% of women-owned businesses). Put another way, on average only about 1 in 22 minority-owned businesses had an existing lender relationship. [cite]
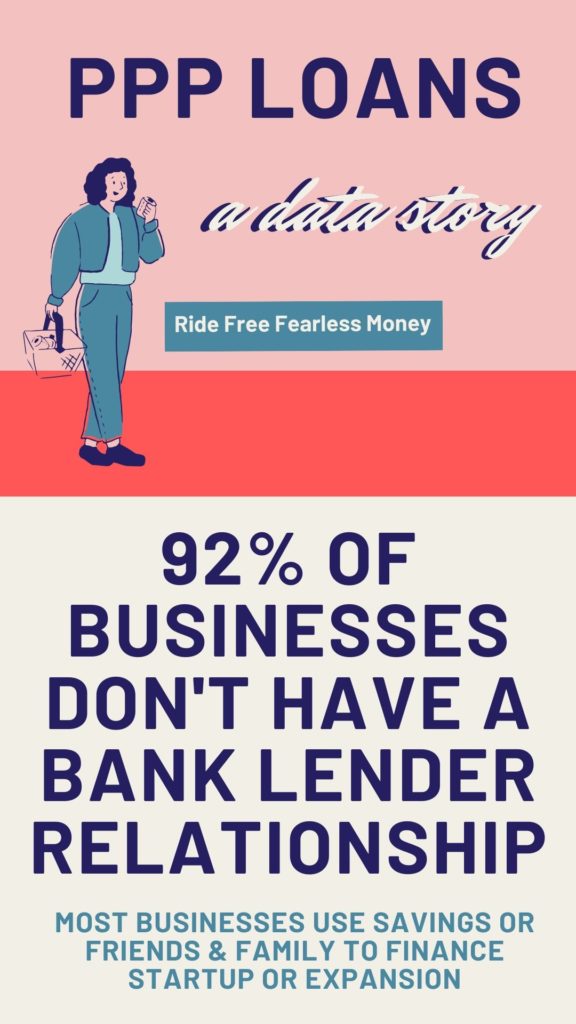
In fact, only 8% of ALL businesses had used bank loans in the past to finance their business, leading us to assume they have an existing relationship with a banking lender.
This means that at least 11 out of 12 entities across all businesses, and up to 19 out of 20 entities for minority- and women-owned businesses, had to scramble to both find a bank AND scrape together applications — if they wanted to try to get PPP funding.
Soooo, who got funded?
Finally, think about that 8% of businesses which had an existing lender relationship. Roughly, that means about 2.2M businesses – meaning if every business that had a relationship with a lender applied for a PPP loan, given that only 1.66M loans were approved, that .55M businesses with relationships didn’t get loans.
Now, we can assume that every business who’s ever used loan financing ever didn’t necessarily apply for the PPP, but some segment certainly did.
The real answers will come out as data on the distribution of loans, but some next questions we might want to ask are:
- Why would the format chosen for the PPP be one that 92% of businesses weren’t familiar with?
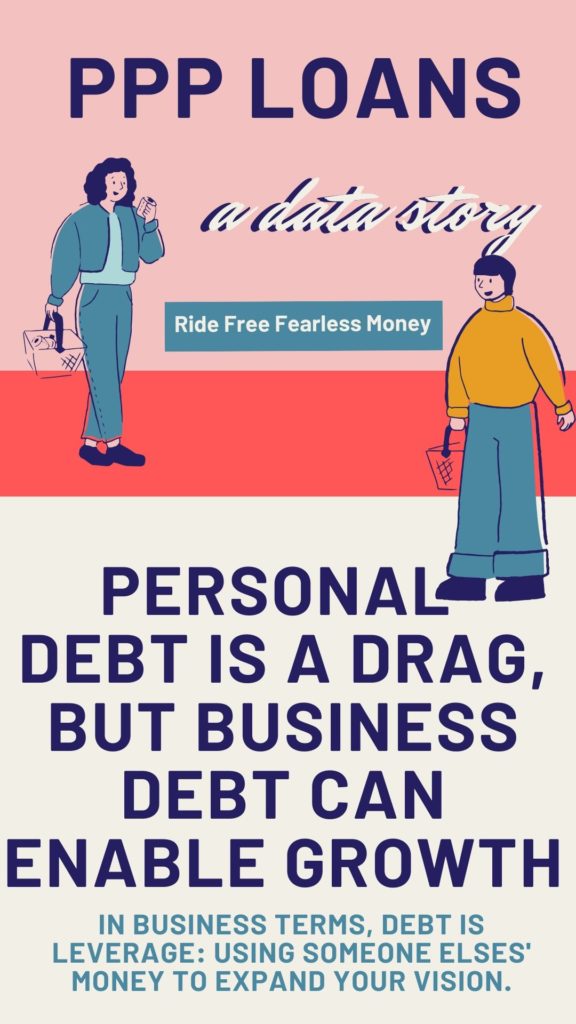
- How might we enable more businesses to take actions necessary to apply for debt-based financing?
- Given that these and other programs are loans (like the Main Street program), How will this new infusion of cash and concepts – that you could, in fact, get cheap money for your business – change how very small and nonemployee businesses seek to fund their work?
Finally, the volume of coverage was low.
The volume of PPP loans out is equivalent to coverage for about 5% of all business entities. Womp womp. That is validated by Lending Tree’s recent survey, which also indicated that 60% of business entities tried to apply for funding. (That would be 19 million entities, which could mean something like 12 more rounds of funding to cover at current levels!) The National Federation of Independent Businesses indicated that 75% of respondents to a survey sent to their member businesses applied for PPP, and as of 4/17, 20% had received funding.
If you scale it back to imagine covering only the businesses with employees, the cash dispersed from PPP loans could be equivalent to $57,268 for each business that has more than 0 but under 500 employees, if it were distributed evenly. (Not that it should be.)
That, and the fact that the funding ran out in under two weeks, slamming banks and overwhelming business owners, means that the next cycle – which opens up 4/27 – is going to be a bit of a wild ride.
************
THE DATA PS*
Now, the data for nonemployers doesn’t separate out operators: consider people like me who file 2 schedule Cs (two NAICS codes) and have LLCs (more NAICS codes!) would be 4 nonemployer entities. Another example: people who own rental real estate tend to have one LLC per property — that’s certainly going to over represent individuals.